Detecting Anti-Vaccine Users on Twitter
Matheus Schmitz, Goran Muric, Keith Burghardt
Vaccine hesitancy, which has recently been driven by online narratives, significantly degrades the efficacy of vaccination strategies, such as those for COVID-19. Despite broad agreement in the medical community about the safety and efficacy of available vaccines, a large number of social media users continue to be inundated with false information about vaccines and are indecisive or unwilling to be vaccinated. The goal of this study is to better understand anti-vaccine sentiment by developing a system capable of automatically identifying the users responsible for spreading anti-vaccine narratives. We introduce a publicly available Python package capable of analyzing Twitter profiles to assess how likely that profile is to share anti-vaccine sentiment in the future. The software package is built using text embedding methods, neural networks, and automated dataset generation and is trained on several million tweets. We find this model can accurately detect anti-vaccine users up to a year before they tweet anti-vaccine hashtags or keywords. We also show examples of how text analysis helps us understand anti-vaccine discussions by detecting moral and emotional differences between anti-vaccine spreaders on Twitter and regular users. Our results will help researchers and policy-makers understand how users become anti-vaccine and what they discuss on Twitter. Policy-makers can utilize this information for better targeted campaigns that debunk harmful anti-vaccination myths.Cite as: M. Schmitz, G. Murić, K. Burghardt. (2022). Detecting Anti-Vaccine Users on Twitter. In: ICWSM 2023 (in press).
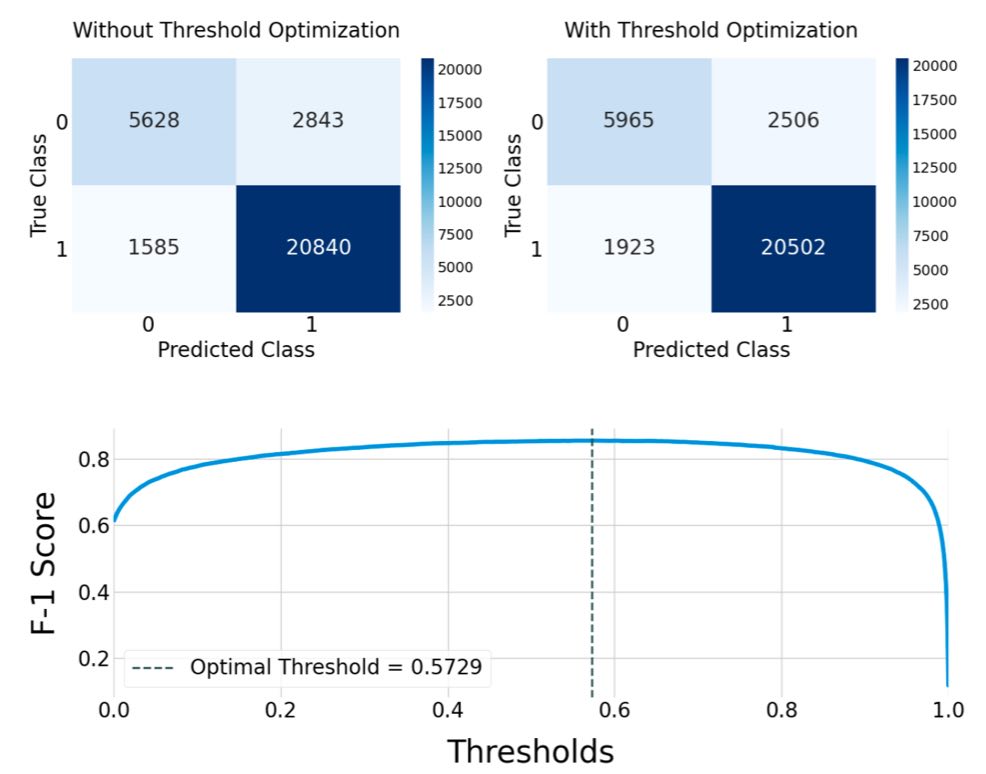 Upper: Confusion Matrix before and after threshold optimization; Lower: Relation between classification threshold and F1-Score. Optimal threshold for the highest F1-Score is 0.5729.
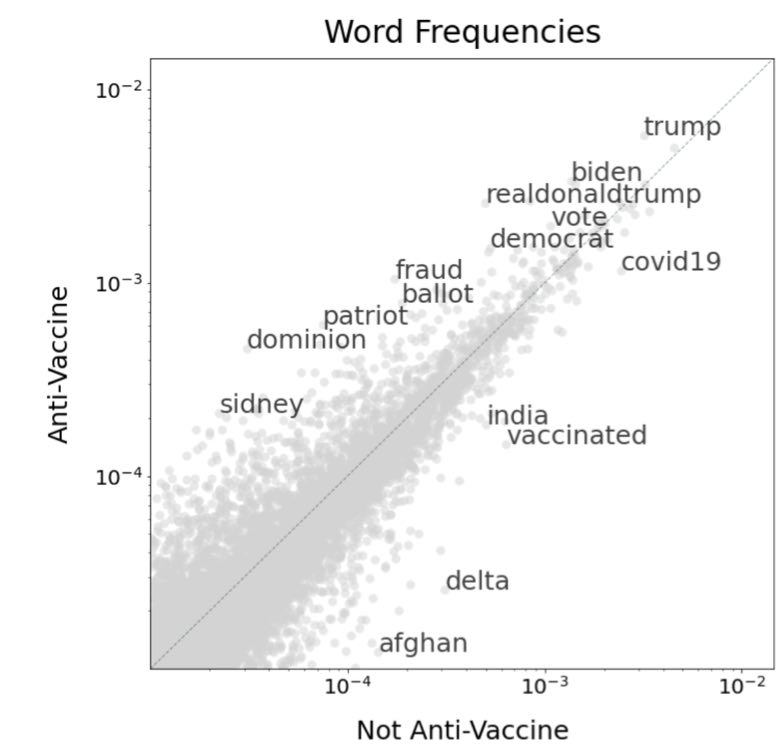 Most frequently used words for anti-vaccine and non anti-vaccine users. A few words used uncommonly often by each respective group are highlighted. Anti-vaccine users show a greater propensity to use conspiratorial langauge (e.g., the conspiracy related to Dominion ballots).
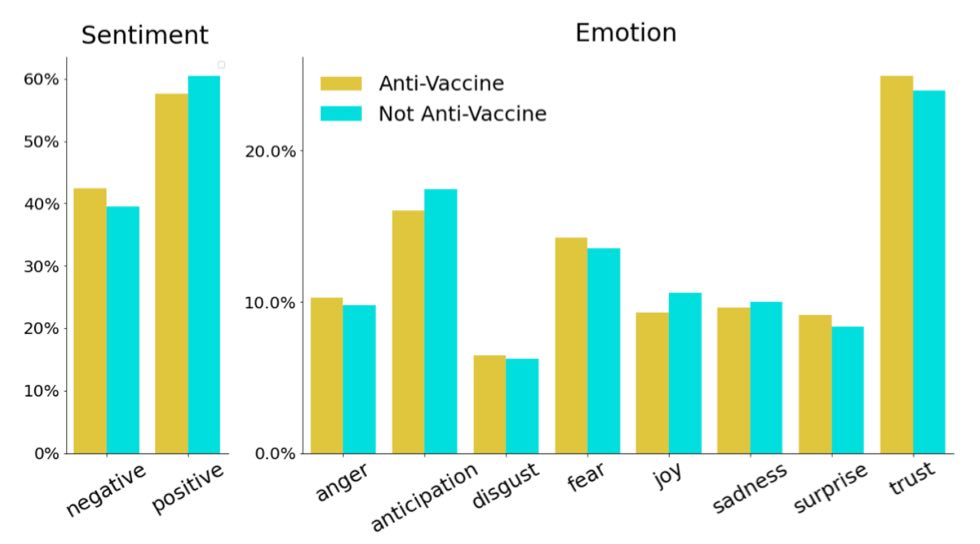 Emotion and Sentiment of tweets from Anti-Vaccination and Non-Anti-Vaccination accounts, based on NRC Lexicon. We notice that anti-vaccine users are much more negative than non-anti-vaccine users.
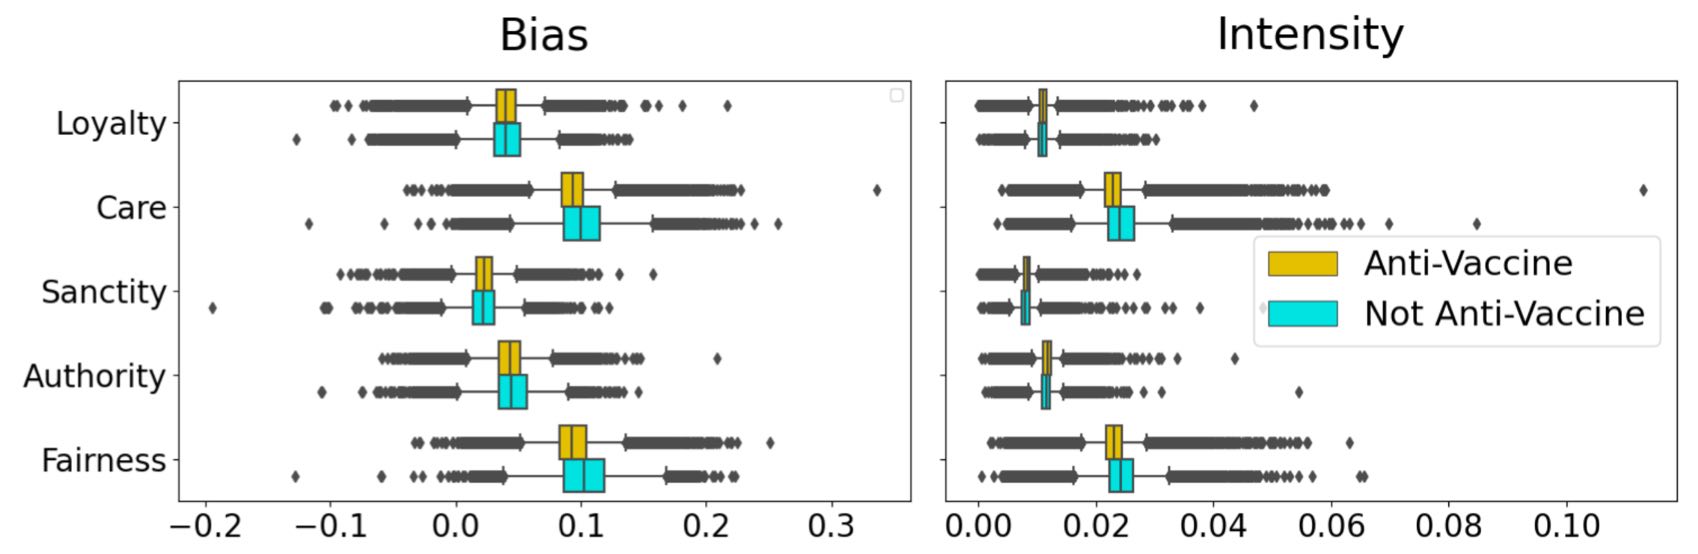 Moral Foundations of anti-vaccine and regular users. (a) Bias (the tendency of words to promote positive or negative aspects of each moral foundation) are typically less positive in anti-vaccine users. (b) Intensity (the focus of words towards particular moral foundations) is also typically lower for anti-vaccine users.
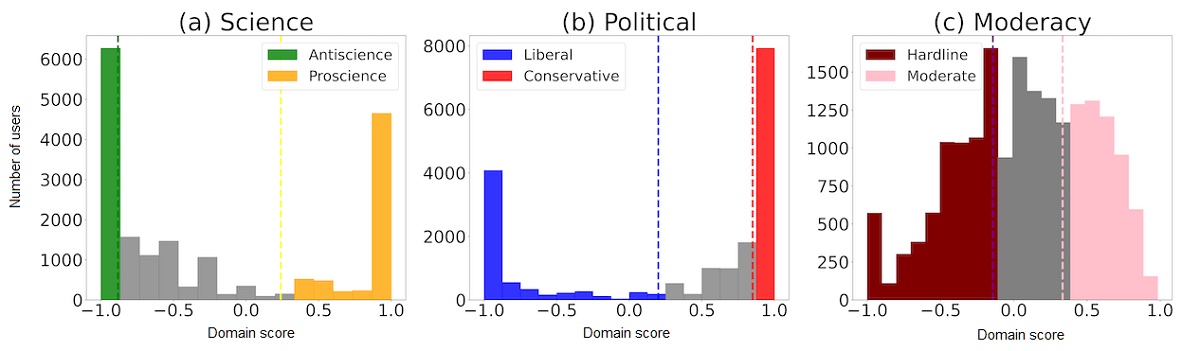 The distribution of domain scores along science, political, and moderacy dimensions. (a) The vertical lines at 0.42 and −1 mark the top and bottom 30% cutoffs of distribution along the science dimension, which are binned as proscience (+1) and antiscience (−1), respectively. (b) The vertical lines at 1 and −0.33 mark the top and bottom 30% cutoffs of distribution along the political dimension, which are binned as conservative (+1) and liberal (−1), respectively. (c) The vertical lines at 0.38 and −0.18 mark the top and bottom 30% cutoffs of distribution along the moderacy dimension, which are binned as moderate (+1) and hardline (−1), respectively.
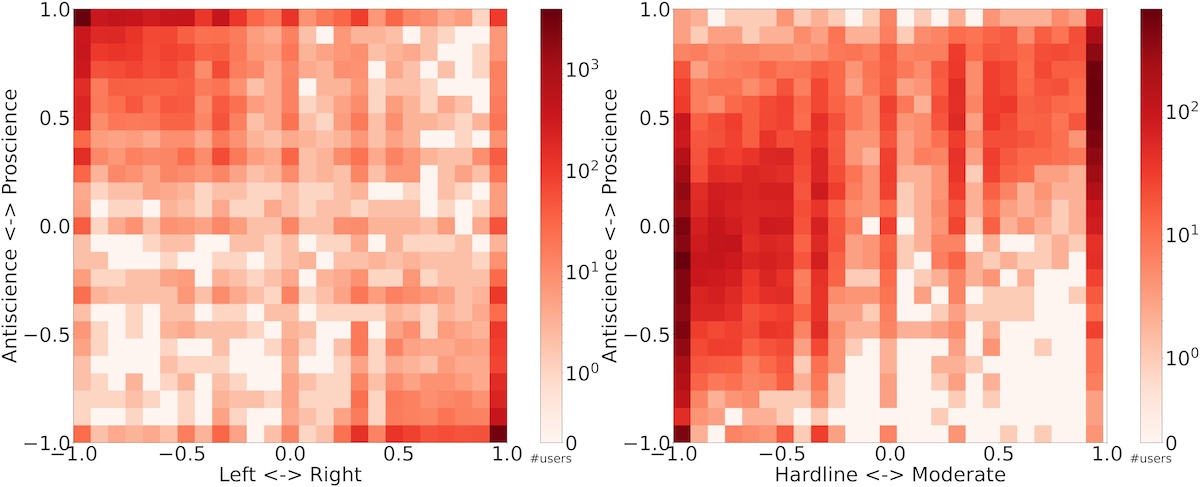 Polarization of COVID-19 tweets. On the left is the heat map of polarization (domain scores) along the science-partisanship dimensions. On the right is the heat map of polarization (domain scores) along the science-moderacy dimensions. Each bin within the heat map represents the number of users with domain scores falling within that bin. We find that tend to be more liberal while anti-science users tend to be more conservative.
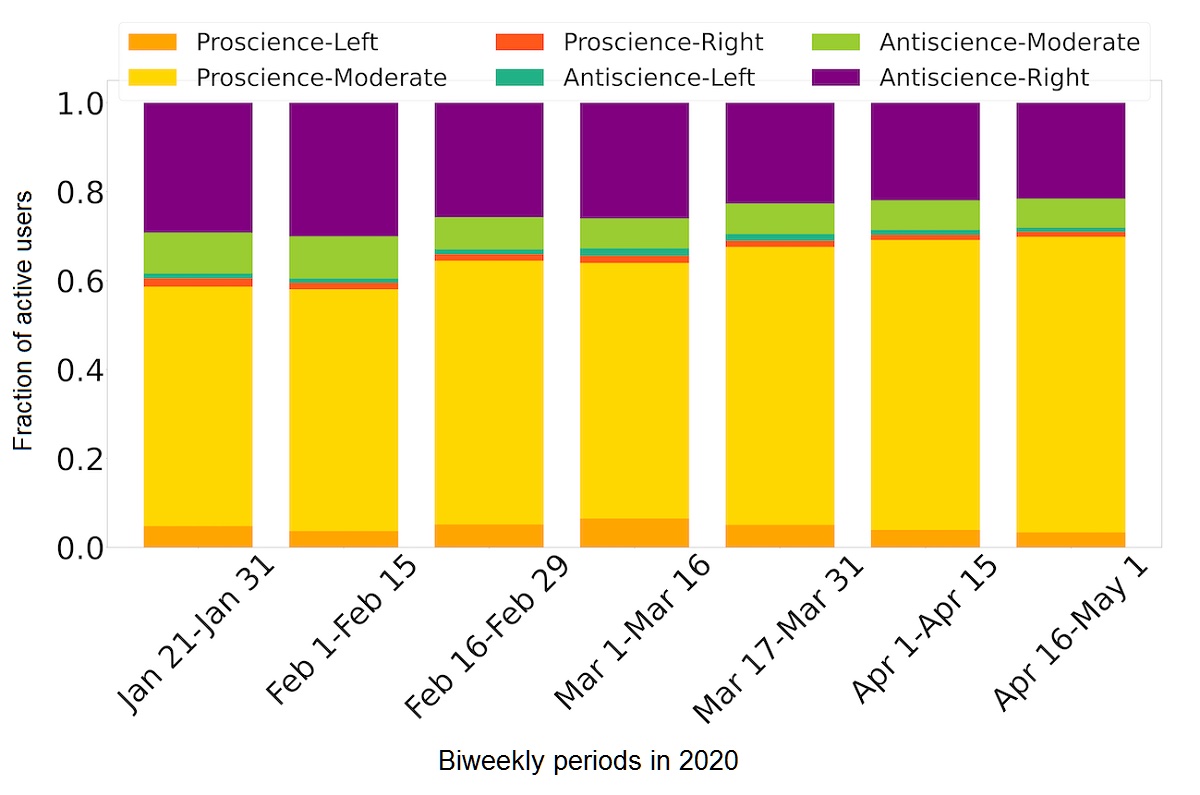 Fraction of active users per ideological group in biweekly periods. Moderate pro-science users become slightly more common over time due to changes in the demographics of users and not because users change their opinions.
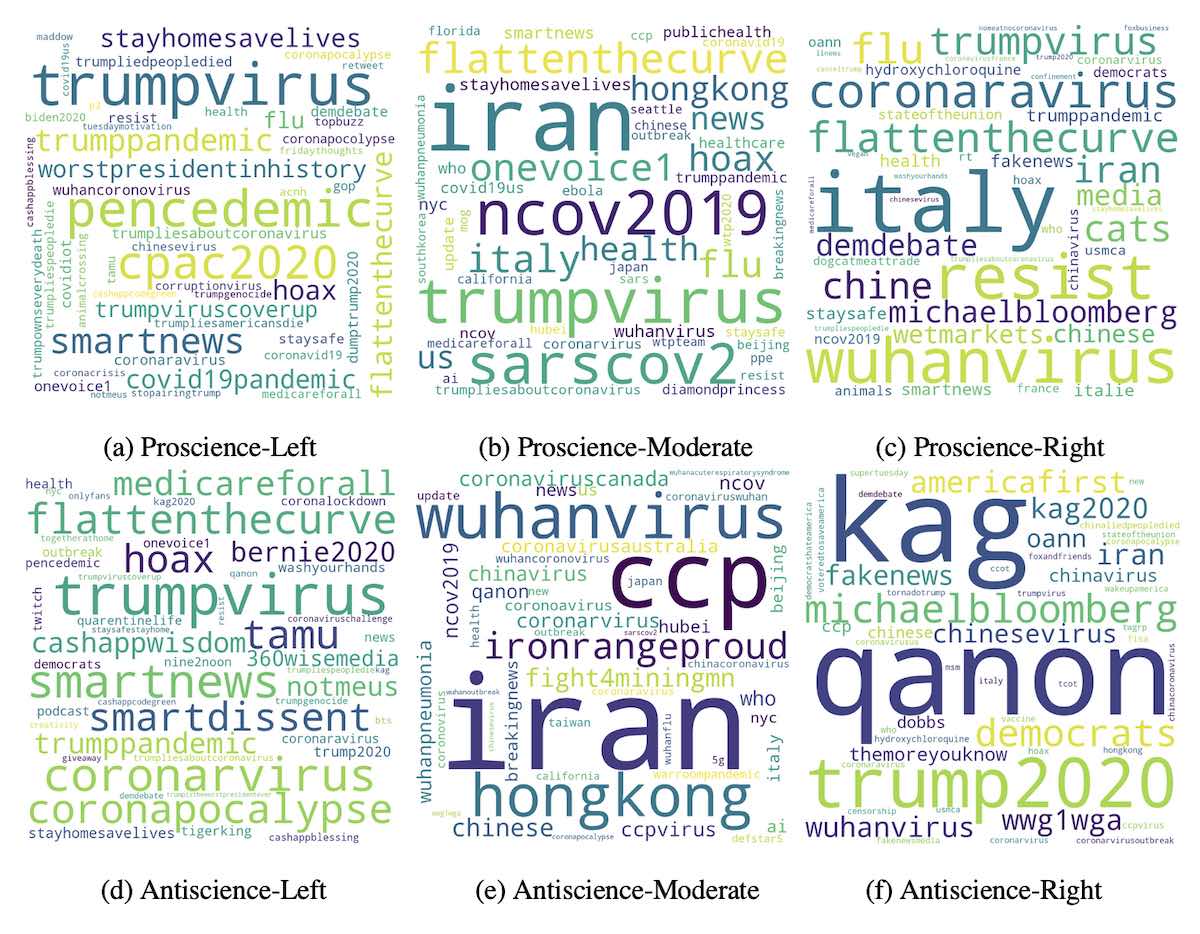 Topics of discussion within the six ideological groups. The top row (from left to right) illustrates topics for proscience-left, proscience-moderate, and proscience-right groups. The bottom row (from left to right) illustrates topics for antiscience-left, antiscience-moderate, and antiscience-right groups.
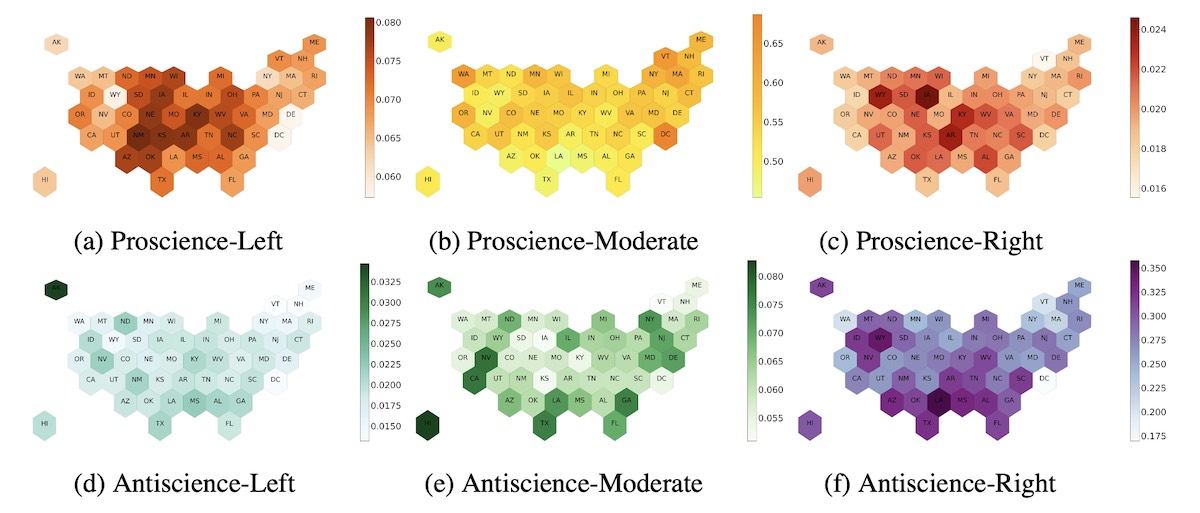 Fraction of US states' Twitter users per ideological category. Plots (a) to (c) (top row, left to right) show the fraction of states' Twitter users who were classified as proscience-left, proscience-moderate, and proscience-right, respectively. Plots (d) to (f) (bottom row, left to right) show the fraction of states’ Twitter users who were classified as antiscience-left, antiscience-moderate, and antiscience-right, respectively. The vertical bars next to the maps indicate the fraction of Twitter users in the state belonging to the ideological group. Two-letter abbreviations are used for each state. We notice that anti-vaccine users tend to cluster in the Southeast and upper Western US. Pro-science moderates, meanwhile, are seen throughout the US, while pro-science liberals and conservatives tend to concentrate in the Midwest and Southwest.